 A treasure trove of health data about every county in Kentucky is available to journalists and community planners looking to draw a statistical picture of their area. That was the message of a webinar hosted by the Foundation for a Healthy Kentucky Wednesday.
"We really hope the information we have on kentuckyhealthfacts.org will start a conversation," said Sarah Walsh of the foundation's "Local Data for Local Action" Initiative.
The website features a map of the state that is broken down by county. By clicking on a county, a plethora of information pops up, including information on a county's:
• demographics, such as graduation rates and per capita personal income;
• social and behavioral indicators, such as lack of physical activity and prevalence of smoking and obesity;
• health outcomes, such as infectious disease rates, motor vehicle deaths and premature death rates;
• access to care, such as flu vaccination rates, and number of available health care providers and physicians;
• maternal and child health, such as infant mortality, teen birth rates and low birthweight rates;
• senior health, such as the percentage of the senior population in a community.
• senior health, such as the percentage of the senior population in a community.
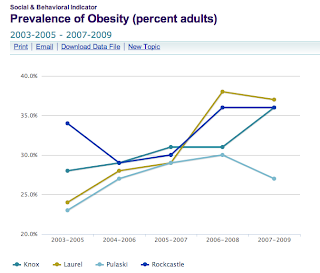
The data can be compared to the rest of the state, the rest of the country or other counties, and users can create tables, bar graphs, line graphs or maps suitable for publication. "There's a lot of information here," Walsh said. (Graph created online shows obesity declining in Laurel and Pulaski counties after three years of increase, but still rising in Knox County and holding steadier in Rockcastle County. Up to six counties can be placed in one such graphic.)
The site is especially valuable to journalists, said Al Cross, director of the Institute for Rural Journalism and Community Issues at the University of Kentucky. "These are the hard facts that local news media need to report as they hold up a mirror to their communities and help them address community problems," Cross said. "In most Kentucky counties, one or more facets of health are a community problem. They need more attention." Kentucky Health News is a service of the institute, funded by the foundation.
Much of the data come from the Centers for Disease Control and Prevention's Behavioral Risk Factor Surveillance Survey, a nationwide, random telephone poll that is conducted each year. Because there may not be enough survey responses from residents in some counties, much of the data on the site have been developed by looking at three or four counties that are near each other and demographically similar, which Walsh said makes the data more "stable and robust." Statisticians have reconfigured the data so that they are all based on a population of 100,000 people, enough to have confidence in the percentages.
While encouraging community planners to use the site, Walsh said the Kentucky Cancer Registry website is "one of the best in the nation" and has cancer-specific data that may not be available on kentuckyhealthfacts.org. She also pointed listeners to the Kids Count website, an Annie E. Casey Foundation-funded project that has statewide data specific to children.
What surfers won't find, however, are Kentucky numbers on the childhood obesity or childhood diabetes. "Different school districts and communities are collecting data but in different ways and at different ages," she said, adding those disparities make comparison analysis difficult. A bill to make schools collect and report body-mass-index data failed in the last session of the General Assembly.
The goal of Wednesday's webinar was to disseminate information so community planners can identify and address health needs in their area. "At the foundation we take a lot of inspiration from the words of Arthur Ashe, 'Start where you are. Use what you have. Do what you can'," Walsh said. "We believe communities can do a lot to change their health status." The webinar was part of the foundation's "Health for a Change: Ignite — Unite — Act" initiative and was the first in an ongoing series. The next session, July 27, will focus on how to plan a community health needs assessment. For more information about the series, click here.

No comments:
Post a Comment